
Absence of a Report Is Not Evidence of a Clean Image
Trivy Operator reports over ~1.5 MiB fail to write, silently. Your largest images — often your riskiest — show zero findings. Here is how to detect it and the trade-offs in fixing it.
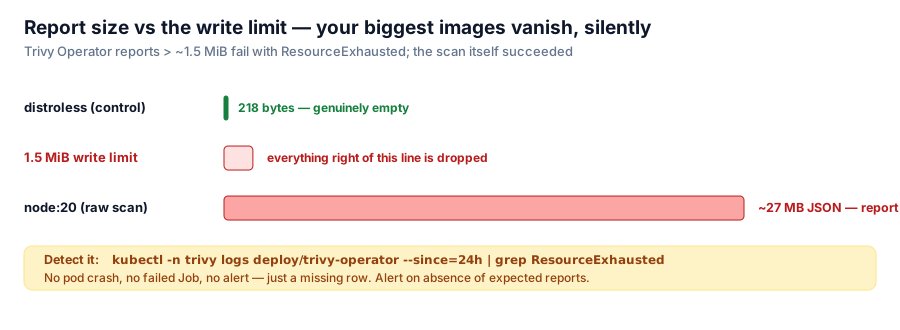
The most dangerous image in your cluster may be the one with no vulnerability report.
The failure mode
Trivy Operator reports above roughly 1.5 MiB fail to write:
rpc error: code = ResourceExhausted
desc = trying to send message larger than max (1868708 vs. 1572864)
The scan itself succeeds. Only the report is discarded. From the dashboard's point of view, the image looks clean — or, more accurately, looks absent, and absent does not raise alerts.
We verified the scale of this: a raw node:20 scan produces ~27 MB of JSON. Any image approaching that size produces no report at all through the operator. The images most likely to vanish from your radar — big application images with hundreds of packages, --list-all-pkgs SBOM payloads — are exactly the ones you most want visibility into.
Detecting it

Everything to the right of the limit exists in the scan but never in the dashboard.
One grep over the operator logs, daily:
kubectl -n trivy logs deploy/trivy-operator --since=24h | grep ResourceExhaustedIf that returns anything, treat every "clean" large image with suspicion until you have scanned it out-of-band:
trivy image --server http://trivy-service.trivy:4954 your/big/image:tagThe CLI and server path has no gRPC message limit; it will happily produce the full report the operator dropped. The operator's numbers and the CLI's numbers for the same image should agree — when they do not, this limit is usually why.
The fix menu, with trade-offs
All three levers reduce report size; all three cost you something. We deliberately left them unapplied until measured, because each one hides data:
| Option | Effect | Trade-off |
trivy.ignoreUnfixed: true | Biggest single reduction | Hides unpatchable CVEs — the ones you must track, even if you cannot fix them |
trivy.severity: "MEDIUM,HIGH,CRITICAL" | Drops LOW/UNKNOWN | Loses completeness; LOW counts toward "is this image worse than its sibling?" |
| Disable SBOM generation | Removes --list-all-pkgs, the main inflater; reclaims ~176 MB of etcd in our case | Costs the "which images contain package X?" query entirely |
The third option deserves its own post — we took it, under duress, after it took the cluster down. The short version: storing per-package SBOMs as custom resources puts an artifact's inventory in etcd, which is the wrong database for it, and the bill arrives all at once.
The general pattern
This failure mode is worth memorising because it recurs everywhere:
- A limit on the reporting path, not the work path. The scan succeeded; the telemetry failed. Any pipeline where the worker and the writer are different processes can produce this split.
- Silent. No pod crash, no failed Job, no alert. Just a missing row.
- Biased against complexity. Small toy images report fine. The bigger the real workload, the more likely it is to disappear from view.
Corollaries: max message sizes on gRPC writers, ingestion payload limits in log pipelines, cardinality limits in metrics stores, maxBodySize in ingress controllers. In every case the question to ask is: what does our data look like at the 99th percentile of size, and does anything at that size get dropped?
And the monitoring inversion to remember: alert on the absence of expected data. Expected report per running image; if a workload has pods but no VulnerabilityReport, that is a finding in itself.
Series: Building a Container Image Security Stack. Next: why we disabled operator SBOM generation entirely — the etcd outage that stopped every Flux reconciliation cluster-wide.